Biomass Module (BM)
Synergies and trade-offs, which might result in the conflicting field of biomass production – provision of ecosystem services, can be analysed with the help of GISCAME and the add-on Biomass Module. The BM facilitates statements regarding the current and future potential of ligniocellulosic (woody) biomass. In dependence from owner type structure (mobilization rates per owner type), forest development (forest conversion according to the climate-adapted forest development types), and land use change in forestry and agriculture (afforestation/planting of short rotation coppices), planning alternatives can be compared and prognoses for future can be made.
Following assessment parameters are considered in the BM:
|
Nr.
|
Parameter
|
Abbreviation
|
Unit
|
Explanation
|
|
1
|
Breast height diameter
|
D
|
[cm]
|
Man diameter at beast height of volume removed
|
|
2
|
Harvested wood
|
Y
|
[m³/ha]
|
harvested volume (yield in cubic meter standing, with bark)
|
|
3
|
current annual increment
|
CAI
|
[m³/ha]
|
mean current annual volume growth of merchantable stem volume for the period of the actual age class
|
|
4
|
yield cumulated
|
Ycum
|
[m³/ha]
|
sum of removed merchantable stem volume since establishment of the stand
|
|
5
|
standing volume
|
SV
|
[m³/ha]
|
total growth of merchantable stem volume
|
|
6
|
mean annual increment
|
MAI
|
[m³/ha]
|
mean annual volume growth of merchantable stem volume for the period since planting
|
|
7
|
fuel wood
|
S-En
|
[m³/ha]
|
Assortment: fuel wood
|
|
8
|
industrial wood
|
S-Ind
|
[m³/ha]
|
Assortment: industrial wood
|
|
9
|
Sortiment Stangen-, Schwellen, Stammholz
|
S-SSS
|
[m³/ha]
|
Assortment: pole stand, timber for ties, stem wood
|
|
10
|
Fuel value
|
FV
|
[kWh/m³]
|
Product of „Y“ and tree species-specific fuel value
|
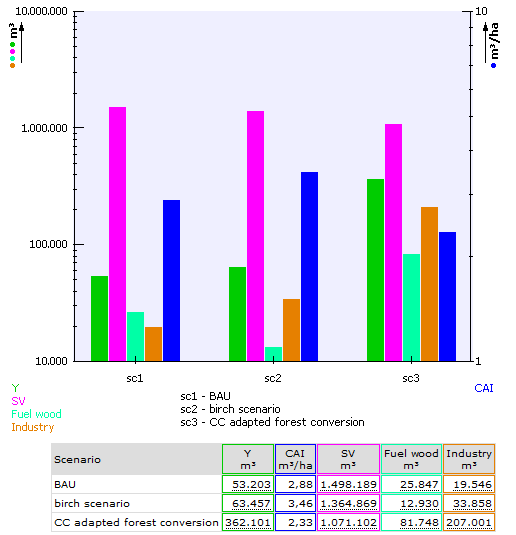
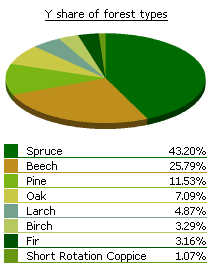
The results of the BM can be illustrated, analysed, and exported for the use in other software programmes in manifold ways. The temporal development of resource production can be illustrated in line or bar charts, where impacts of thinnings of final fellings become visible (left). Also, the contribution of each tree species to a parameter value can be illustrated in pie charts (right). Export formats are .txt, .csv, .or png, so that reports can be printed or data can be used in other software, such as ArcGIS or EXCEL.
 
How silvicultural and agricultural management strategies affect the provision of various ecosystem services can be assessed in the GISCAME core system. Hence, quantitative analyses can be underpinned by qualitative estimations of trends of potential provision of ecosystem services and can be discussed with forestry- and regional planners. |